It is really important for companies and enterprises to calculate their financial health in order to control capital and make the right investments. That's where ratio analysis comes in as the financial detective, unearthing buried signs and giving a clear picture of a company's financial health.
Join us on this informative adventure as we delve into the domain of ratio analysis and investigate its critical function in determining a company's financial viability.
Ratio analysis is similar to a financial magnifying glass in that it allows us to zoom in on a company's financial statements and extract relevant insights. It is the study of the correlations between various financial numbers in order to derive conclusions about a company's performance and stability.
These ratios provide context and perspective in addition to raw information.
|
“Ratio analysis is the financial magnifying glass that reveals a company's true health – from liquidity to profitability, it's the key to informed decisions. Discover its power and how TallyPrime simplifies the journey.” |
Why should business use or look at ratios?
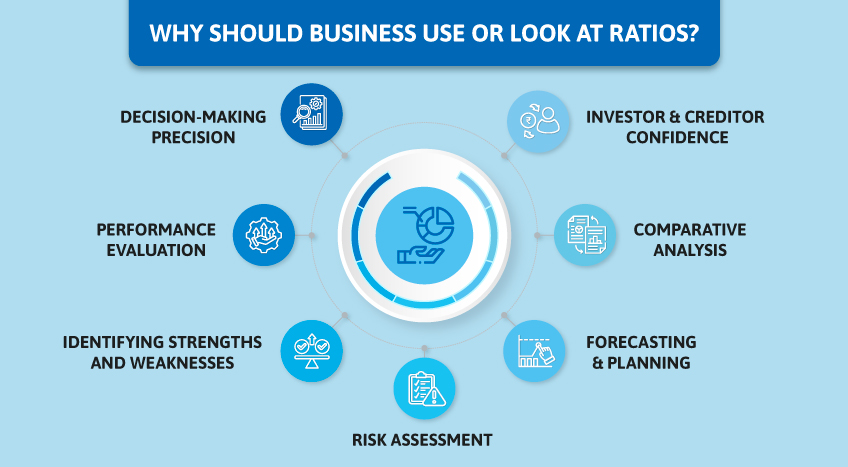
In the dynamic landscape of business, where decisions can make or break an enterprise, understanding and harnessing the power of ratio is important. Ratio analysis serves as a financial GPS, guiding businesses on a path towards informed decisions and sustainable growth. Let's delve into the compelling reasons why businesses should embrace ratios and the objectives that this analysis seeks to achieve.
Decision-making precision
Ratios provide a concise snapshot of a company's financial performance, enabling decision-makers to evaluate various aspects of their operations. From assessing profitability and liquidity to gauging efficiency and solvency, ratios offer a well-rounded view that supports precise decision-making.
Performance evaluation
Businesses aim to measure their success over time, and ratios serve as the yardstick. By comparing current ratios with historical data or industry benchmarks, companies can track their progress and identify areas needing improvement. This evaluation fosters continuous growth and adaptability.
Identifying strengths and weaknesses
Ratios unveil both the strengths and weaknesses of a business. They pinpoint areas of operational excellence as well as areas that might need corrective measures. Businesses can channel their efforts effectively by focusing on enhancing strengths and addressing weaknesses.
Risk assessment
Every business operates in an environment fraught with risks. Ratios aid in risk assessment by shedding light on the company's ability to meet financial obligations and handle unexpected challenges. This is particularly important for potential lenders and investors who seek assurance of the company's financial stability.
Forecasting and planning
Successful businesses are forward-looking, and ratios assist in crafting accurate forecasts and plans. By analyzing trends in ratios, companies can anticipate future financial scenarios, align their strategies, and allocate resources accordingly.
Comparative analysis
Ratios enable businesses to compare their financial performance with that of competitors or industry standards. This benchmarking aids in identifying areas where the company outperforms or lags behind, offering insights for strategic differentiation.
Investor and creditor confidence
For businesses seeking external funding, ratios serve as a language that investors and creditors understand. A healthy set of ratios signifies stability and competence, fostering investor confidence and improving creditworthiness.
Key ratios that matter to business
In the intricate web of financial analysis, certain key ratios act as guiding stars for businesses, illuminating their performance and indicating areas that demand attention. These ratios are categorized into distinct groups, each offering valuable insights into different aspects of a company's financial health.
Liquidity ratios
These ratios measure a company's ability to meet short-term obligations. The Current Ratio (current assets divided by current liabilities) and the Quick Ratio (liquid assets divided by current liabilities) showcase a company's capacity to cover its immediate debts, providing insight into its financial flexibility.
Profitability ratios
These ratios gauge a company's ability to generate profit relative to its revenue, assets, or equity. The Gross Profit Margin (gross profit divided by revenue) and the Net Profit Margin (net profit divided by revenue) reveal the company's efficiency in cost management and profit generation.
Solvency ratios
Solvency ratios assess a company's long-term financial sustainability by evaluating its ability to meet its long-term debt obligations. The Debt-to-Equity Ratio (total debt divided by total equity) and Interest Coverage Ratio (earnings before interest and taxes divided by interest expense) indicate the company's reliance on external financing and its capacity to manage debt payments.
Efficiency ratios
Efficiency ratios delve into the company's operational efficiency and asset management. The Inventory Turnover Ratio (cost of goods sold divided by average inventory) and the Accounts Receivable Turnover Ratio (net credit sales divided by average accounts receivable) measure how effectively a company manages its resources and collects payments.
Market ratios
These ratios provide insights into a company's market value and investors' perceptions. The Price-to-Earnings Ratio (stock price divided by earnings per share) and the Price-to-Book Ratio (stock price divided by book value per share) shed light on how the market values the company's earnings and assets.
How TallyPrime can help you?
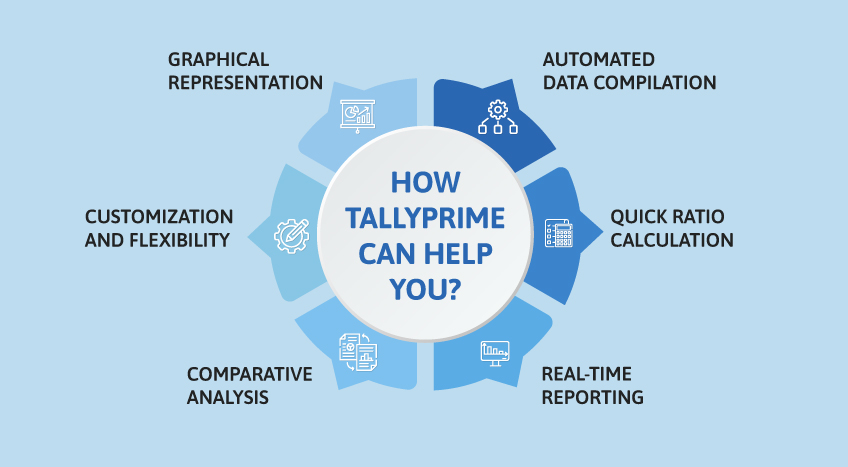
TallyPrime, a versatile business management software, can significantly streamline and enhance the process of ratio analysis, making it more efficient and insightful for businesses. Here's how TallyPrime can assist you in conducting ratio analysis:
Automated data compilation
TallyPrime automates the process of gathering financial data from various sources, including balance sheets, income statements, and cash flow statements. This eliminates manual data entry errors and ensures accurate and up-to-date information for ratio calculations.
Quick ratio calculation
TallyPrime allows you to calculate various ratios using its built-in features effortlessly. With a few clicks, you can generate liquidity ratios like the Current Ratio and Quick Ratio, providing instant insights into your company's short-term financial health.
Real-time reporting
Through TallyPrime's real-time reporting capabilities, you can access dynamic and interactive financial reports. This enables you to monitor key ratios and financial indicators as they evolve over time, aiding in proactive decision-making.
Comparative analysis
TallyPrime enables easy comparison of ratios across different periods, helping you identify trends and changes in your company's financial performance. This feature is invaluable for tracking improvements or identifying areas that need attention.
Customization and flexibility
The software allows you to customize reports and dashboards, tailoring them to your specific needs and preferences. This flexibility empowers you to focus on the ratios that matter most to your business and industry.
Graphical representation
TallyPrime can transform complex numerical data into visually engaging graphs and charts. This visual representation of ratios enhances your ability to communicate financial insights to stakeholders who may not be well-versed in financial terminology.
Wrapping up
Financial metrics are the company's performance, stability, and growth potential. Whether evaluating liquidity, profitability, or efficiency, ratios illuminate the path forward. However, navigating the intricate landscape of ratio analysis can be complex. It is where TallyPrime shines as a guiding light. With its automated data compilation, real-time reporting, and user-friendly interface, TallyPrime transforms ratio analysis into a seamless process.
It empowers businesses to make sense of their financial data, confidently enabling strategic decision-making. Embrace the power of ratios and leverage TallyPrime to unlock valuable insights that shape your business's trajectory. From startups to established enterprises, the dynamic interplay between ratio analysis and TallyPrime promises a journey of growth, adaptability, and financial wisdom.